
For over two years, Argonaut’s feature additions have been towards the goal of making deployments effortless for developer teams. This gave rise to all our major features today, such as out-of-the-box Kubernetes management, a unified interface across multi-cloud environments, ArgoCD-managed deployment pipelines, and more!
Today, we deviate from that path and ship our first feature to help with FinOps. Introducing two new features for Cloud Cost Management - Cost Reports and Cost Dashboards. These add a whole new dimension of cloud cost visibility and provide our users with data on month-over-month spending, along with further resource, account, and region-level drill-downs.
🤑 It's free for everyone
This is a feature that we believe should be available to all our users. So we’ve made it free for everyone. You can connect as many AWS accounts as you want and view your costs in a single dashboard. We’re also working on adding support for GCP and Azure costs in the near future.
🔔 Why is this important?
As the adoption of cloud continues to grow, companies are increasingly focusing on managing their cloud costs. Recent trends such as rising cloud costs due to the global economic crisis, hidden egress costs, and the need to eliminate unnecessary cloud spend have made cost management a key challenge for organizations. In fact, 82% of respondents across all organizations stated that their biggest cloud challenge was managing cloud spend.
To address these challenges, companies are turning to strategies such as data optimization, multi-cloud adoption, intelligent storage, and private cloud investments. Additionally, there is a growing focus on FinOps, the practice of bringing financial accountability to the variable spend model of the cloud.
🛣️ Our journey to Cloud cost management
In 2022, we took our first strides into providing visibility into cloud costs for our customers. With our decision to integrate infracost into our product, we provided cost estimates for infra modules to our users. Later, we gave insight into monthly costs incurred by resource type that was available in the infra tab.
Today, the launch of two new cloud cost management features - Cost Dashboards and Cost Reports makes Argonaut even more capable as an internal platform. These are both designed to provide a complete view of your AWS costs in an easy-to-digest format. And it’s completely free for startups.
📊 Cost Dashboard
Cost Dashboards are designed to provide full visibility of AWS cloud costs in three intuitive, pre-built dashboards. We’ve designed them keeping in mind the various resources our users have running across regions that are connected to multiple AWS accounts.
The three basic dashboards are - All Accounts, All Regions, and All Resources. Each dashboard gives you the option to customize the date range and provides a graph as well as a table view. The option to export the dashboard will be available soon.
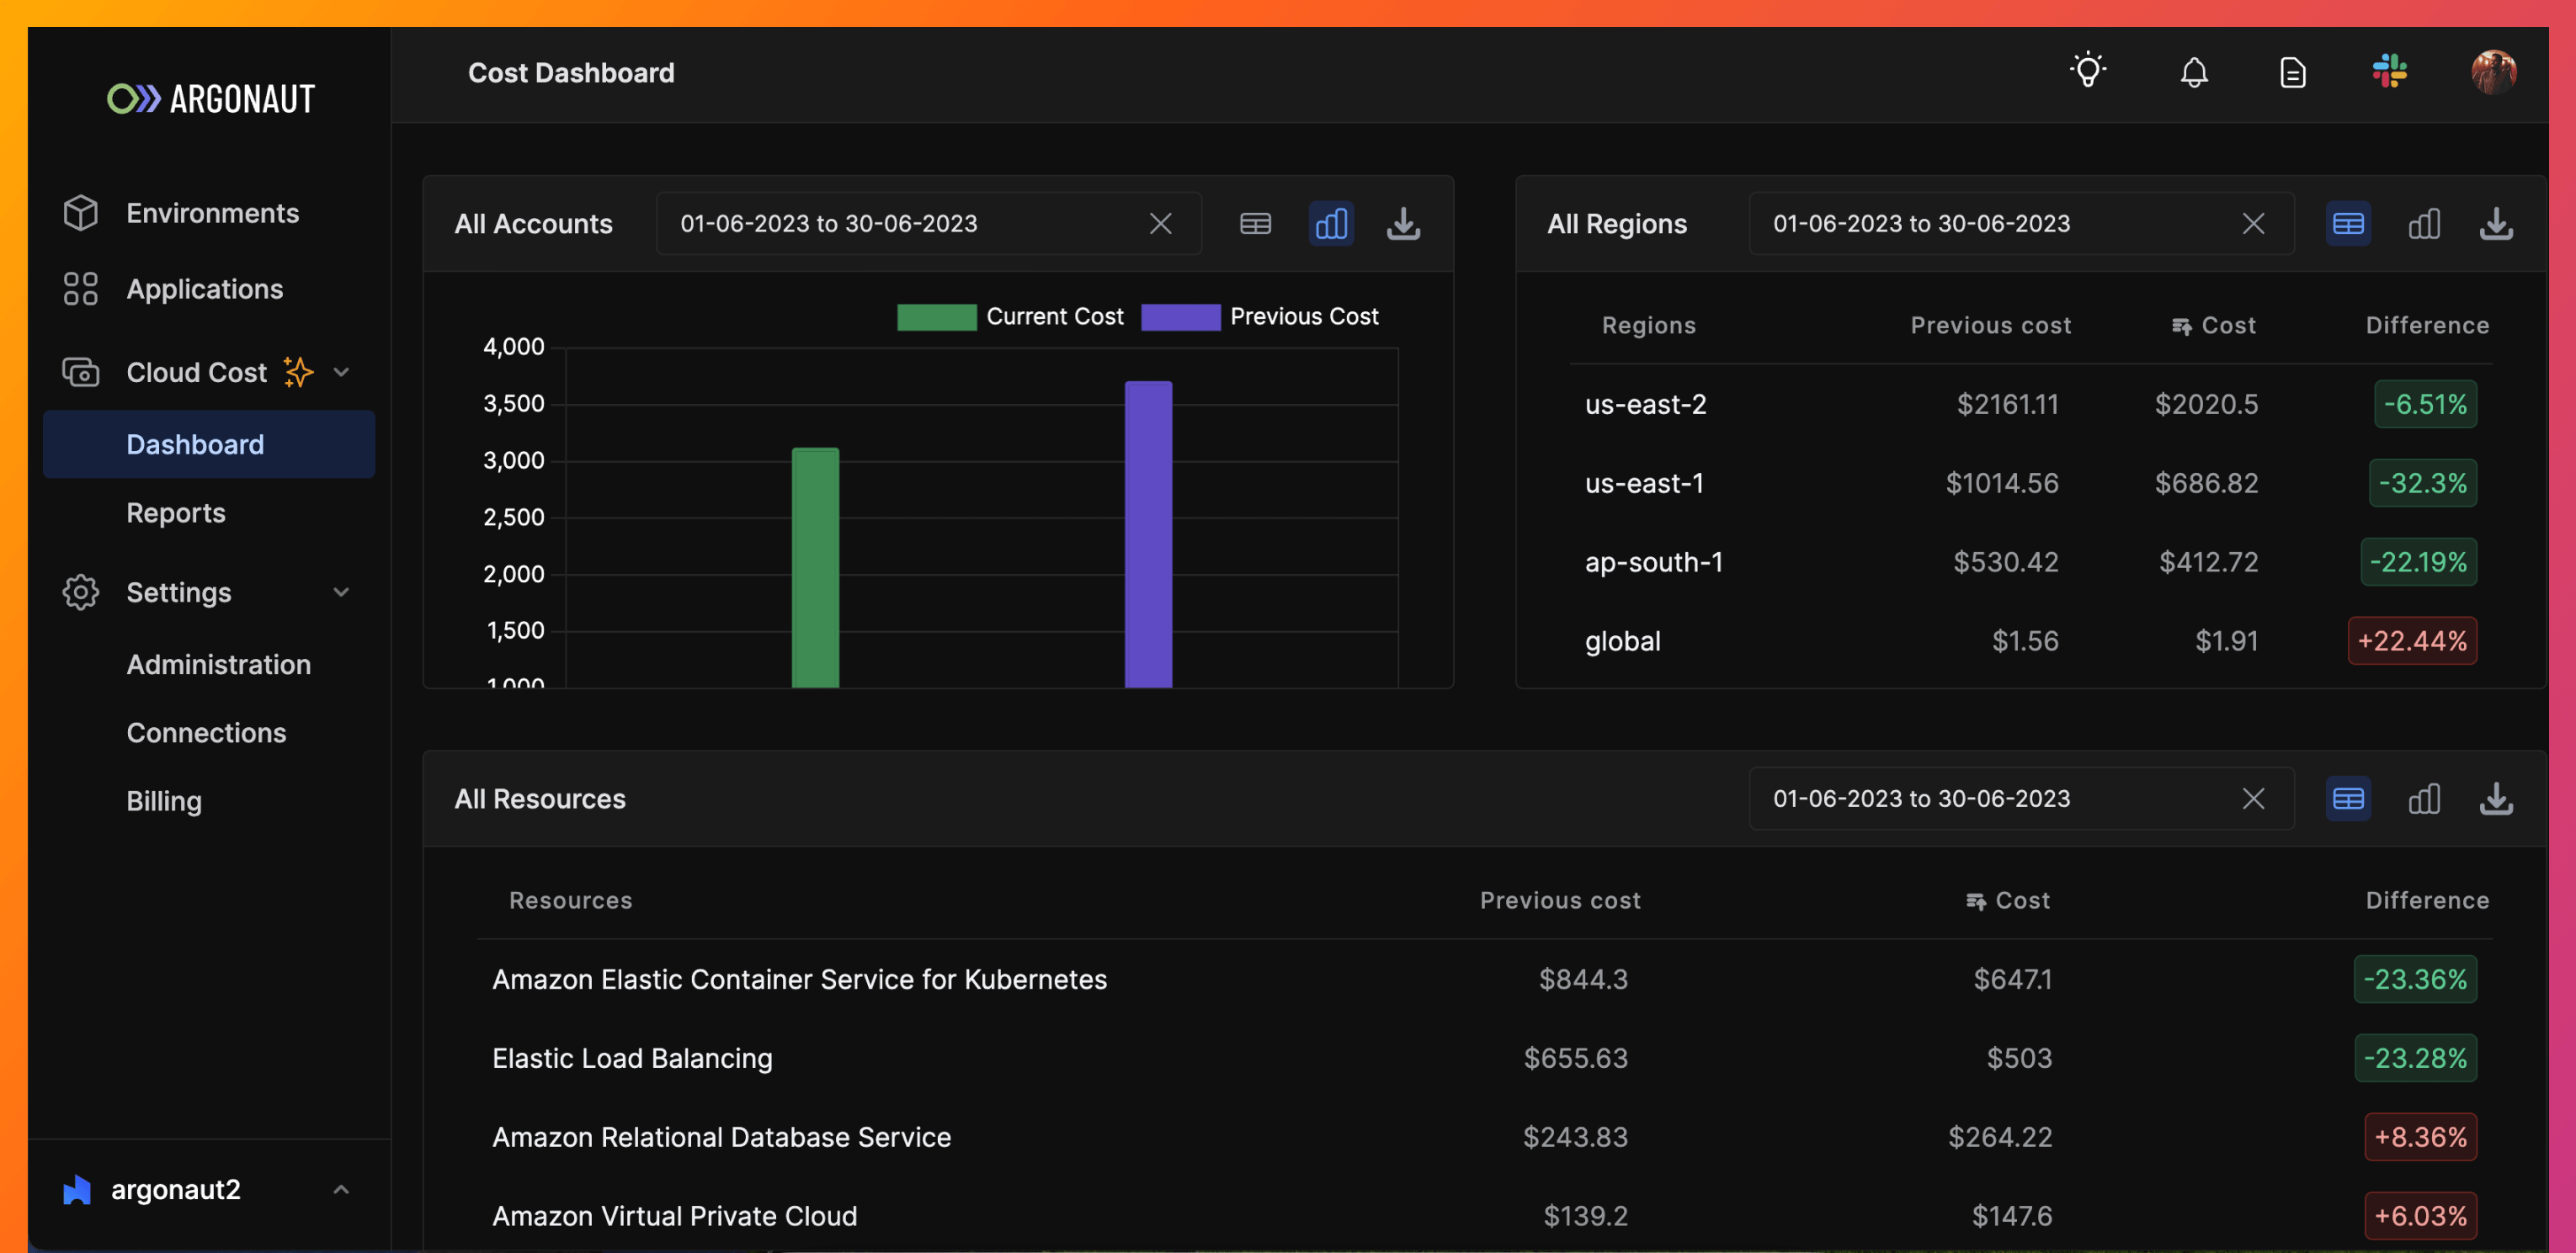
You can sort any column of the dashboard’s table view. And the cost difference indicator is an easy way to check whether your cloud spending is on the right path.
💡 We only report the resources that are used in the chosen date range in some amount.
💡 Costs are rounded to the second decimal. Tiny costs may show as $0 due to rounding. For instance, $0.00001 becomes $0.00, and $1.56432 becomes $1.56.
📉 Cost Reports
Cost Reports provide a more customized view of your AWS costs. There are no limits on the number of reports you can create. This provides full customizability using the available filters.
Once your connection is successful, we create three reports for you by default. These are named All Resources, All Regions, and All Accounts. Below, you can see what the All Resources report looks like with our sample data.
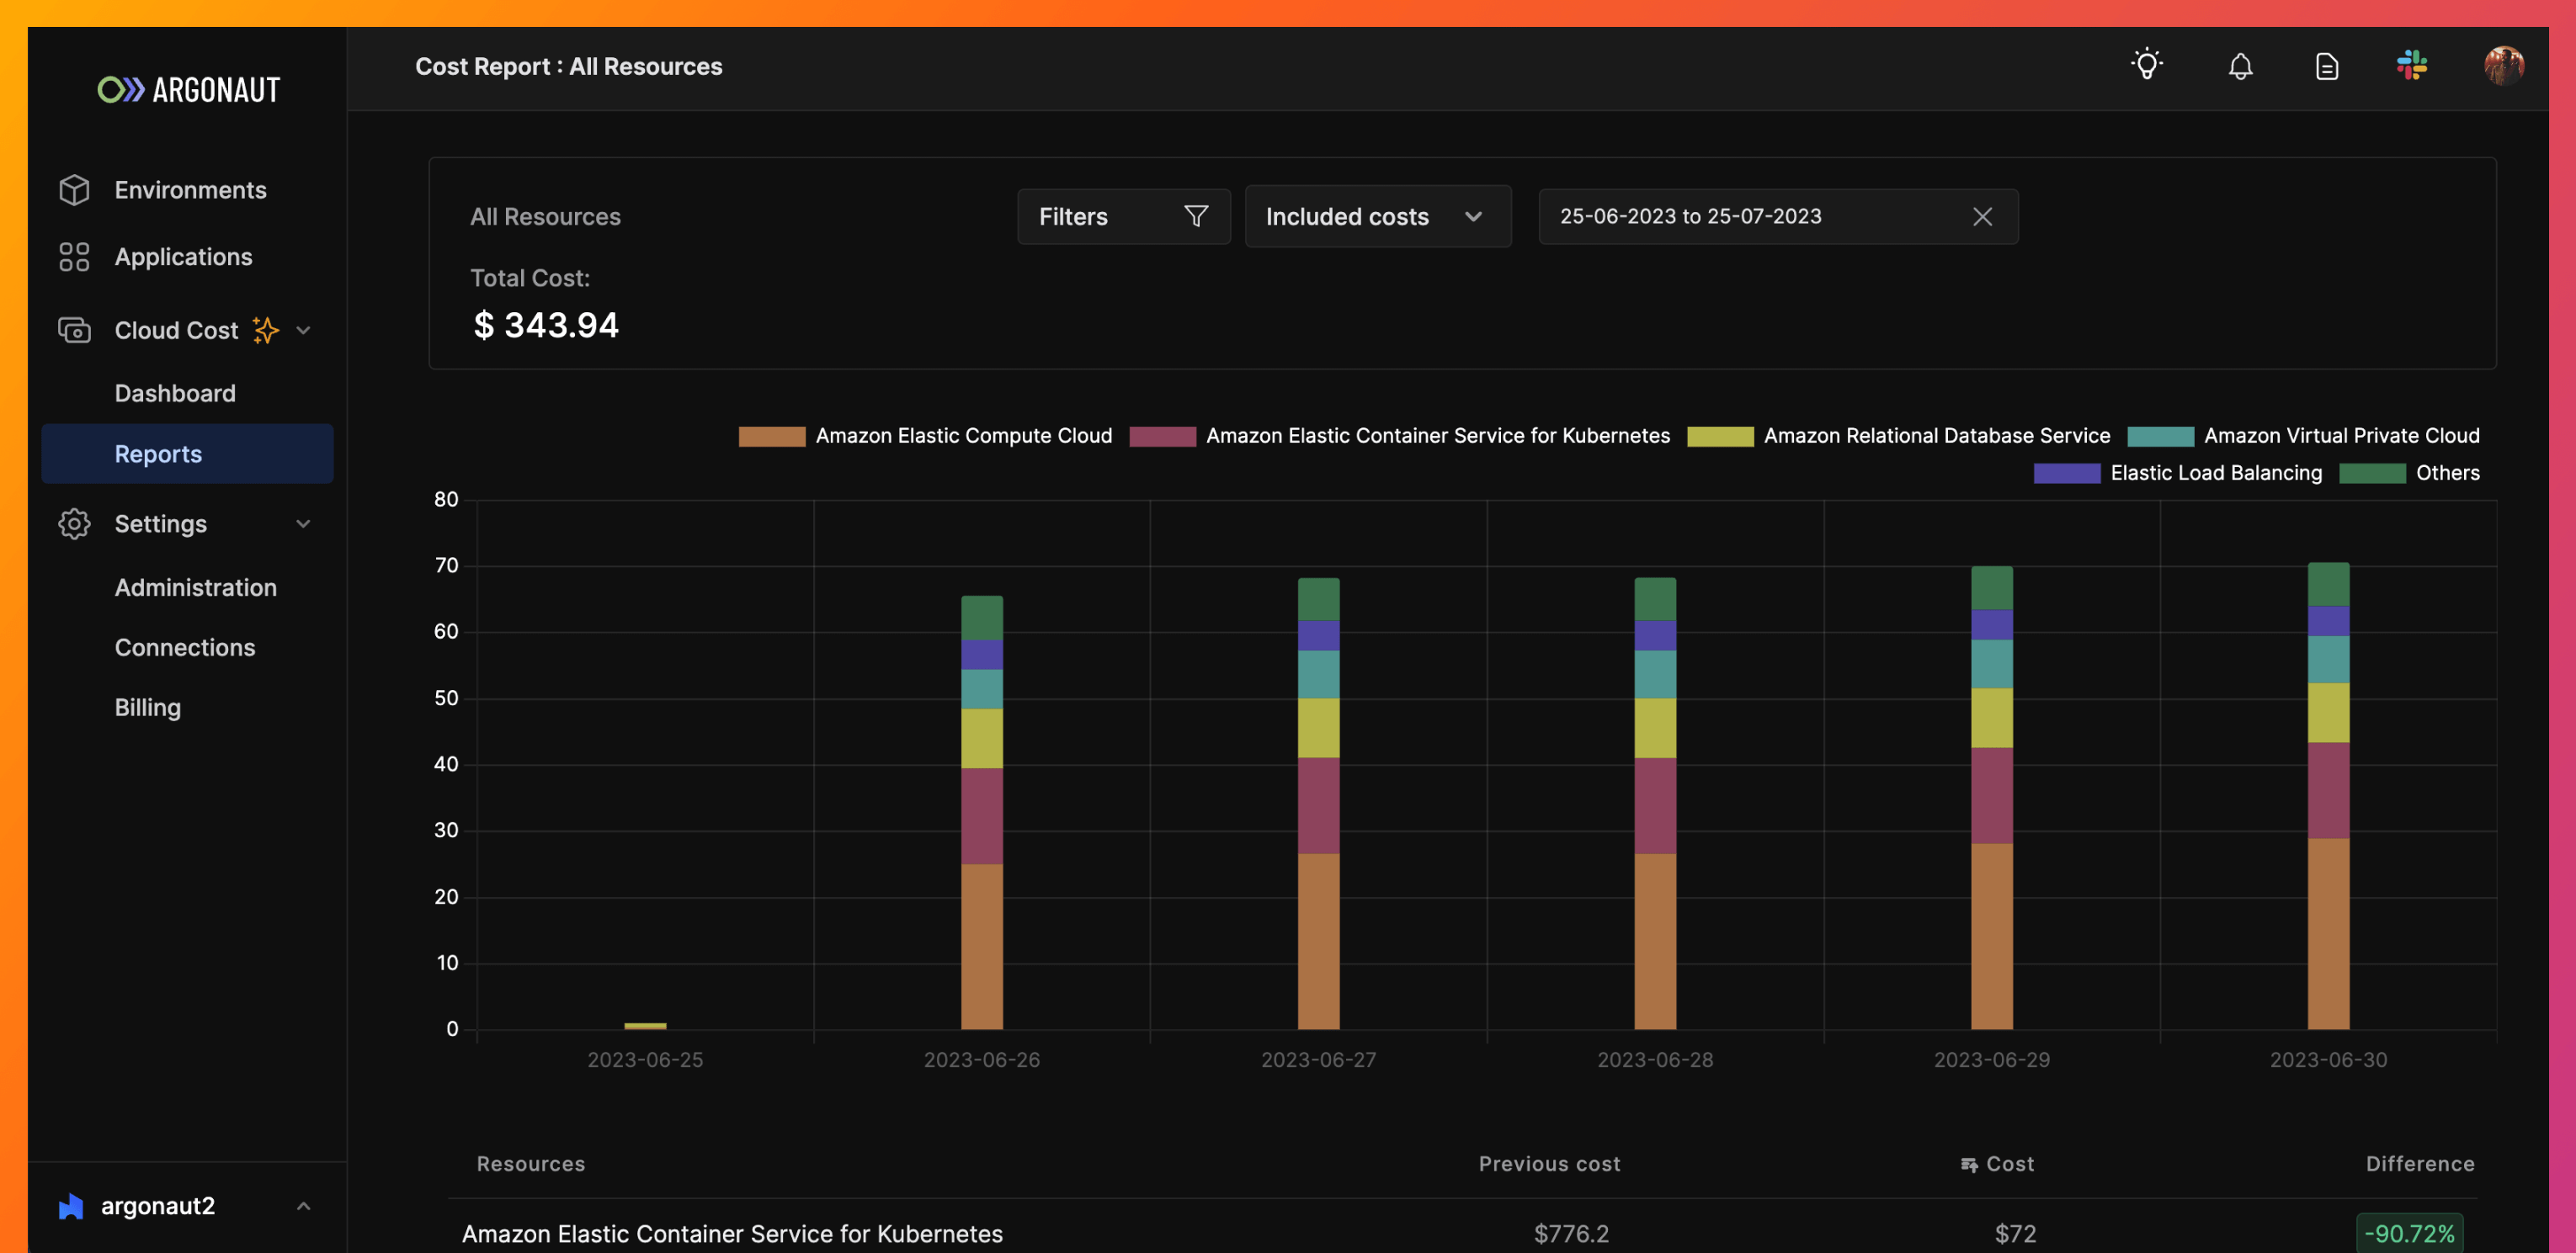
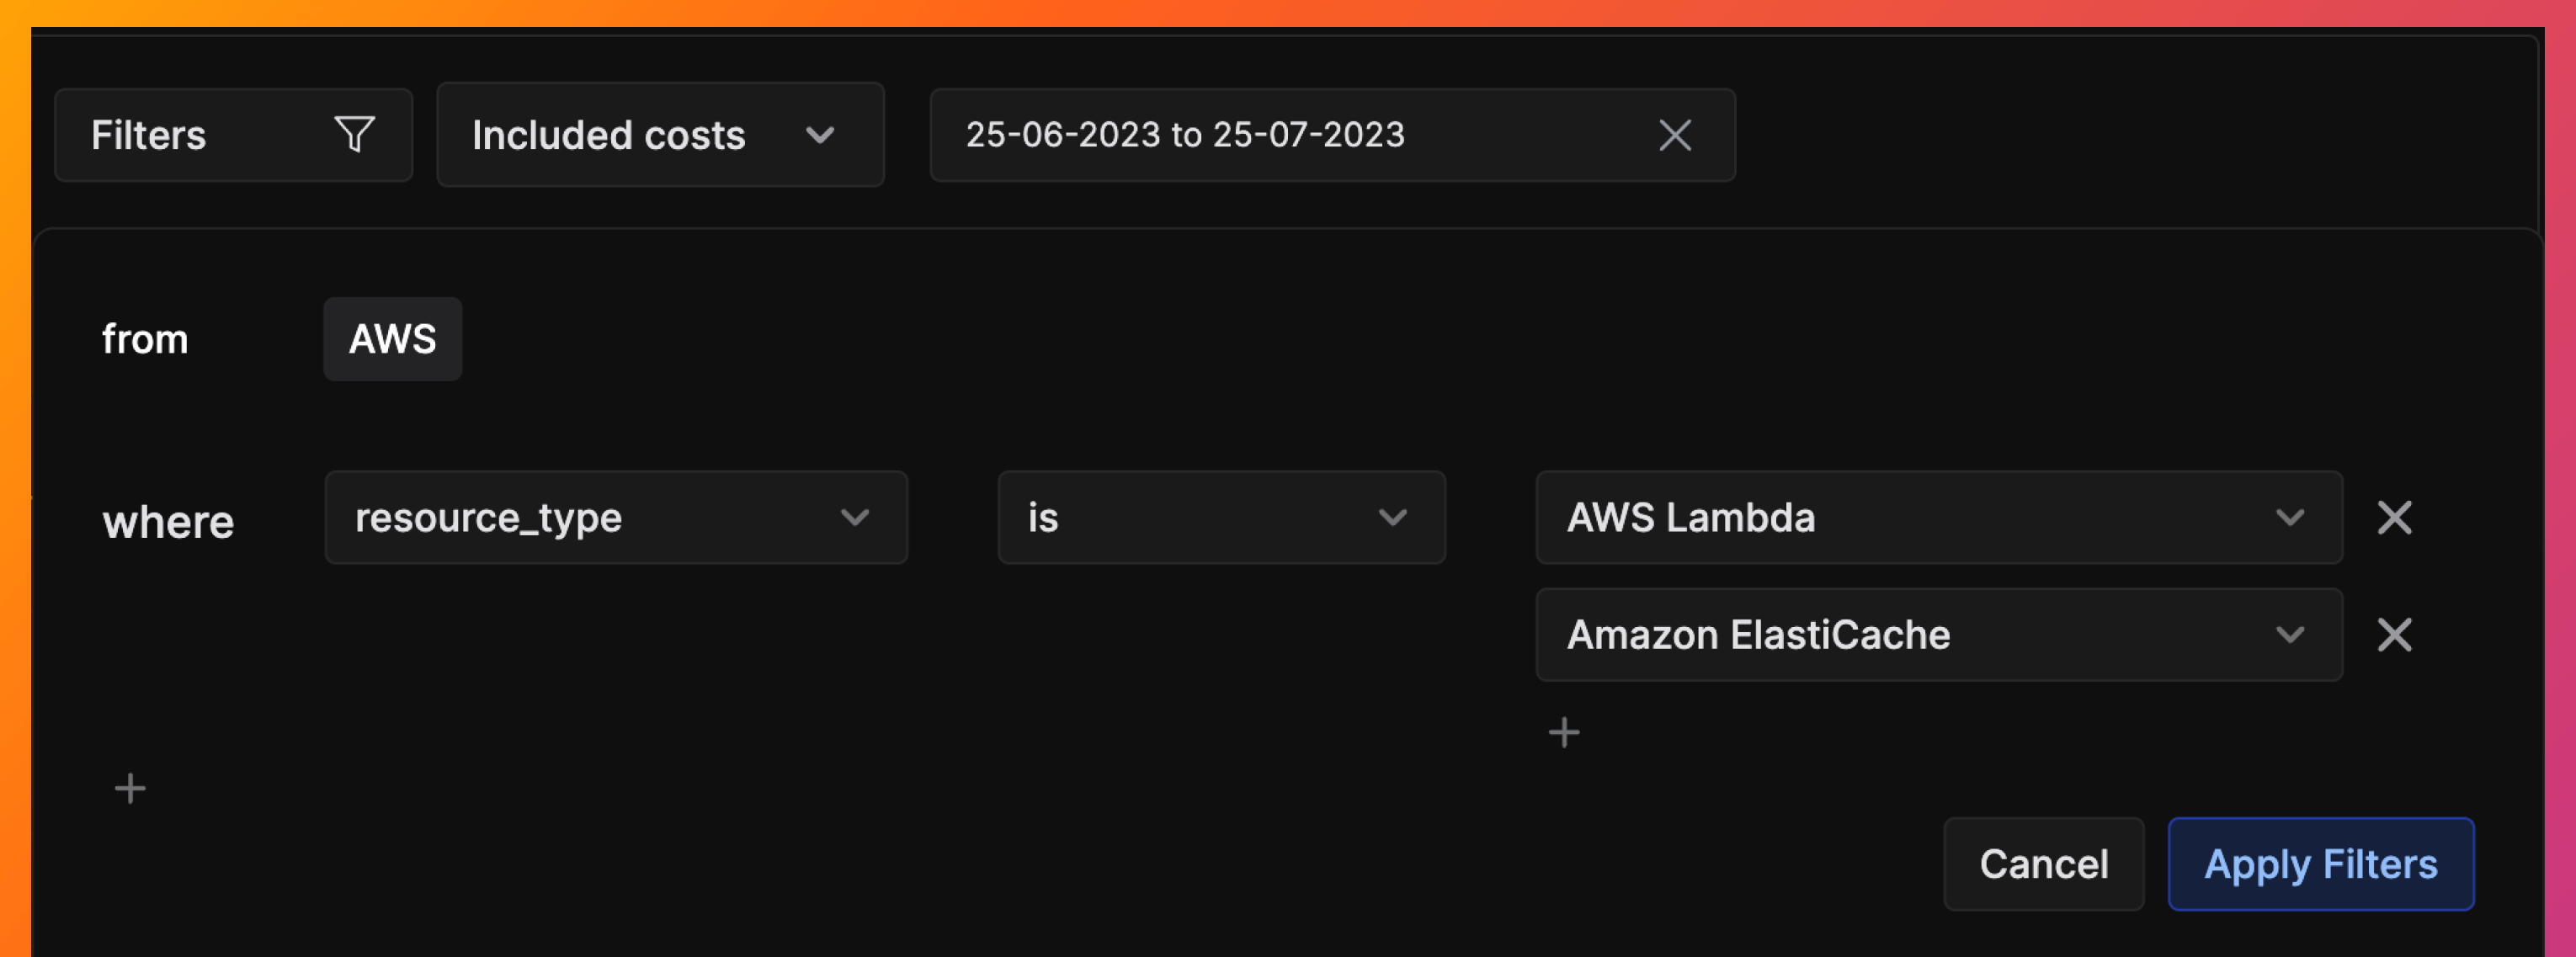
Reports provide two additional ways to look at your costs. The ability to add Filters and the option to include other costs, like Credits, Taxes, etc., in your report. Filters are a great way to slice and dice your costs to examine the granular details. Once you have added in the filters, the table view below will also show your costs on an instance level.
🔐 Permissions
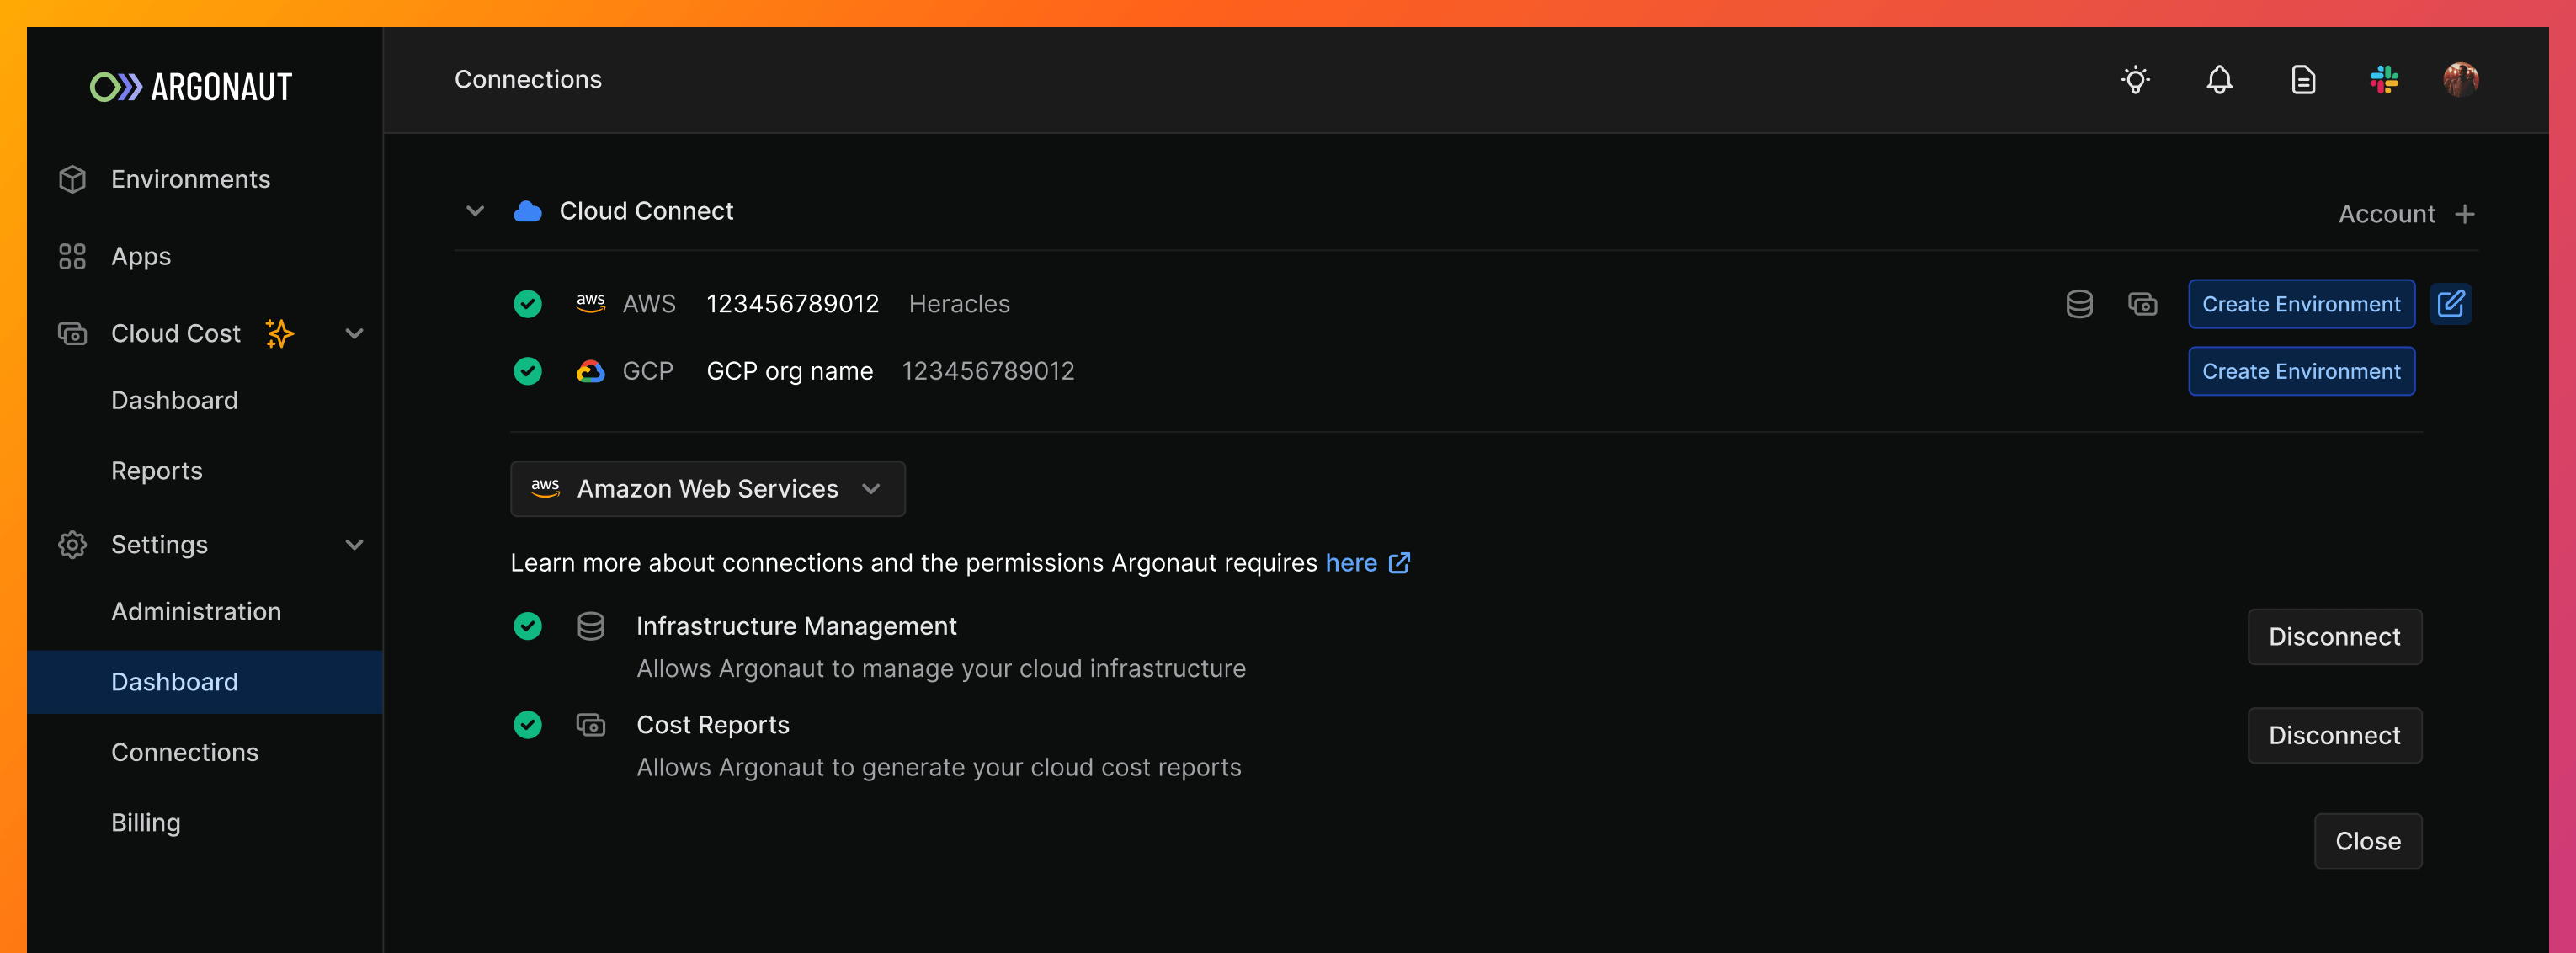
To view your AWS costs using Argonaut, you only need to provide minimal read-only permissions. To get started with the cloud dashboard and cloud reports, you’ll first have to provide the Cost Management permissions from your Connections page under settings. Quick Start guide here.
Connecting multiple AWS accounts can be achieved in the same way. Once the connections are made, all reports and dashboards are viewable to everyone on your Argonaut Workspace.
Docs - Quick start with Cost Reports
✨ Upcoming features
Here’s a look at the upcoming cost management-related features we’ve got planned.
- Export cloud costs in various formats (PNG, PDF, XLSX)
- View both AWS and GCP costs
- Add third-party provider costs
- Cost saving recommendations
📣 Let us know what you think
If it’s your first time trying Argonaut, we have more features to help you deploy effortlessly to the cloud, check them out on our Product page.
We’d love to hear about how our users are utilizing our new cost management feature. Feel free to join our Slack Channel and drop us a note.